Revenue, referrals, retention, and provider productivity. Real-time dashboards built from your actual clinic data.
Capabilities
Every metric comes from your live data. No manual exports, no spreadsheet reconciliation.
Total revenue, MRR, and collections by day, week, month, or quarter. Broken down by service line and provider.
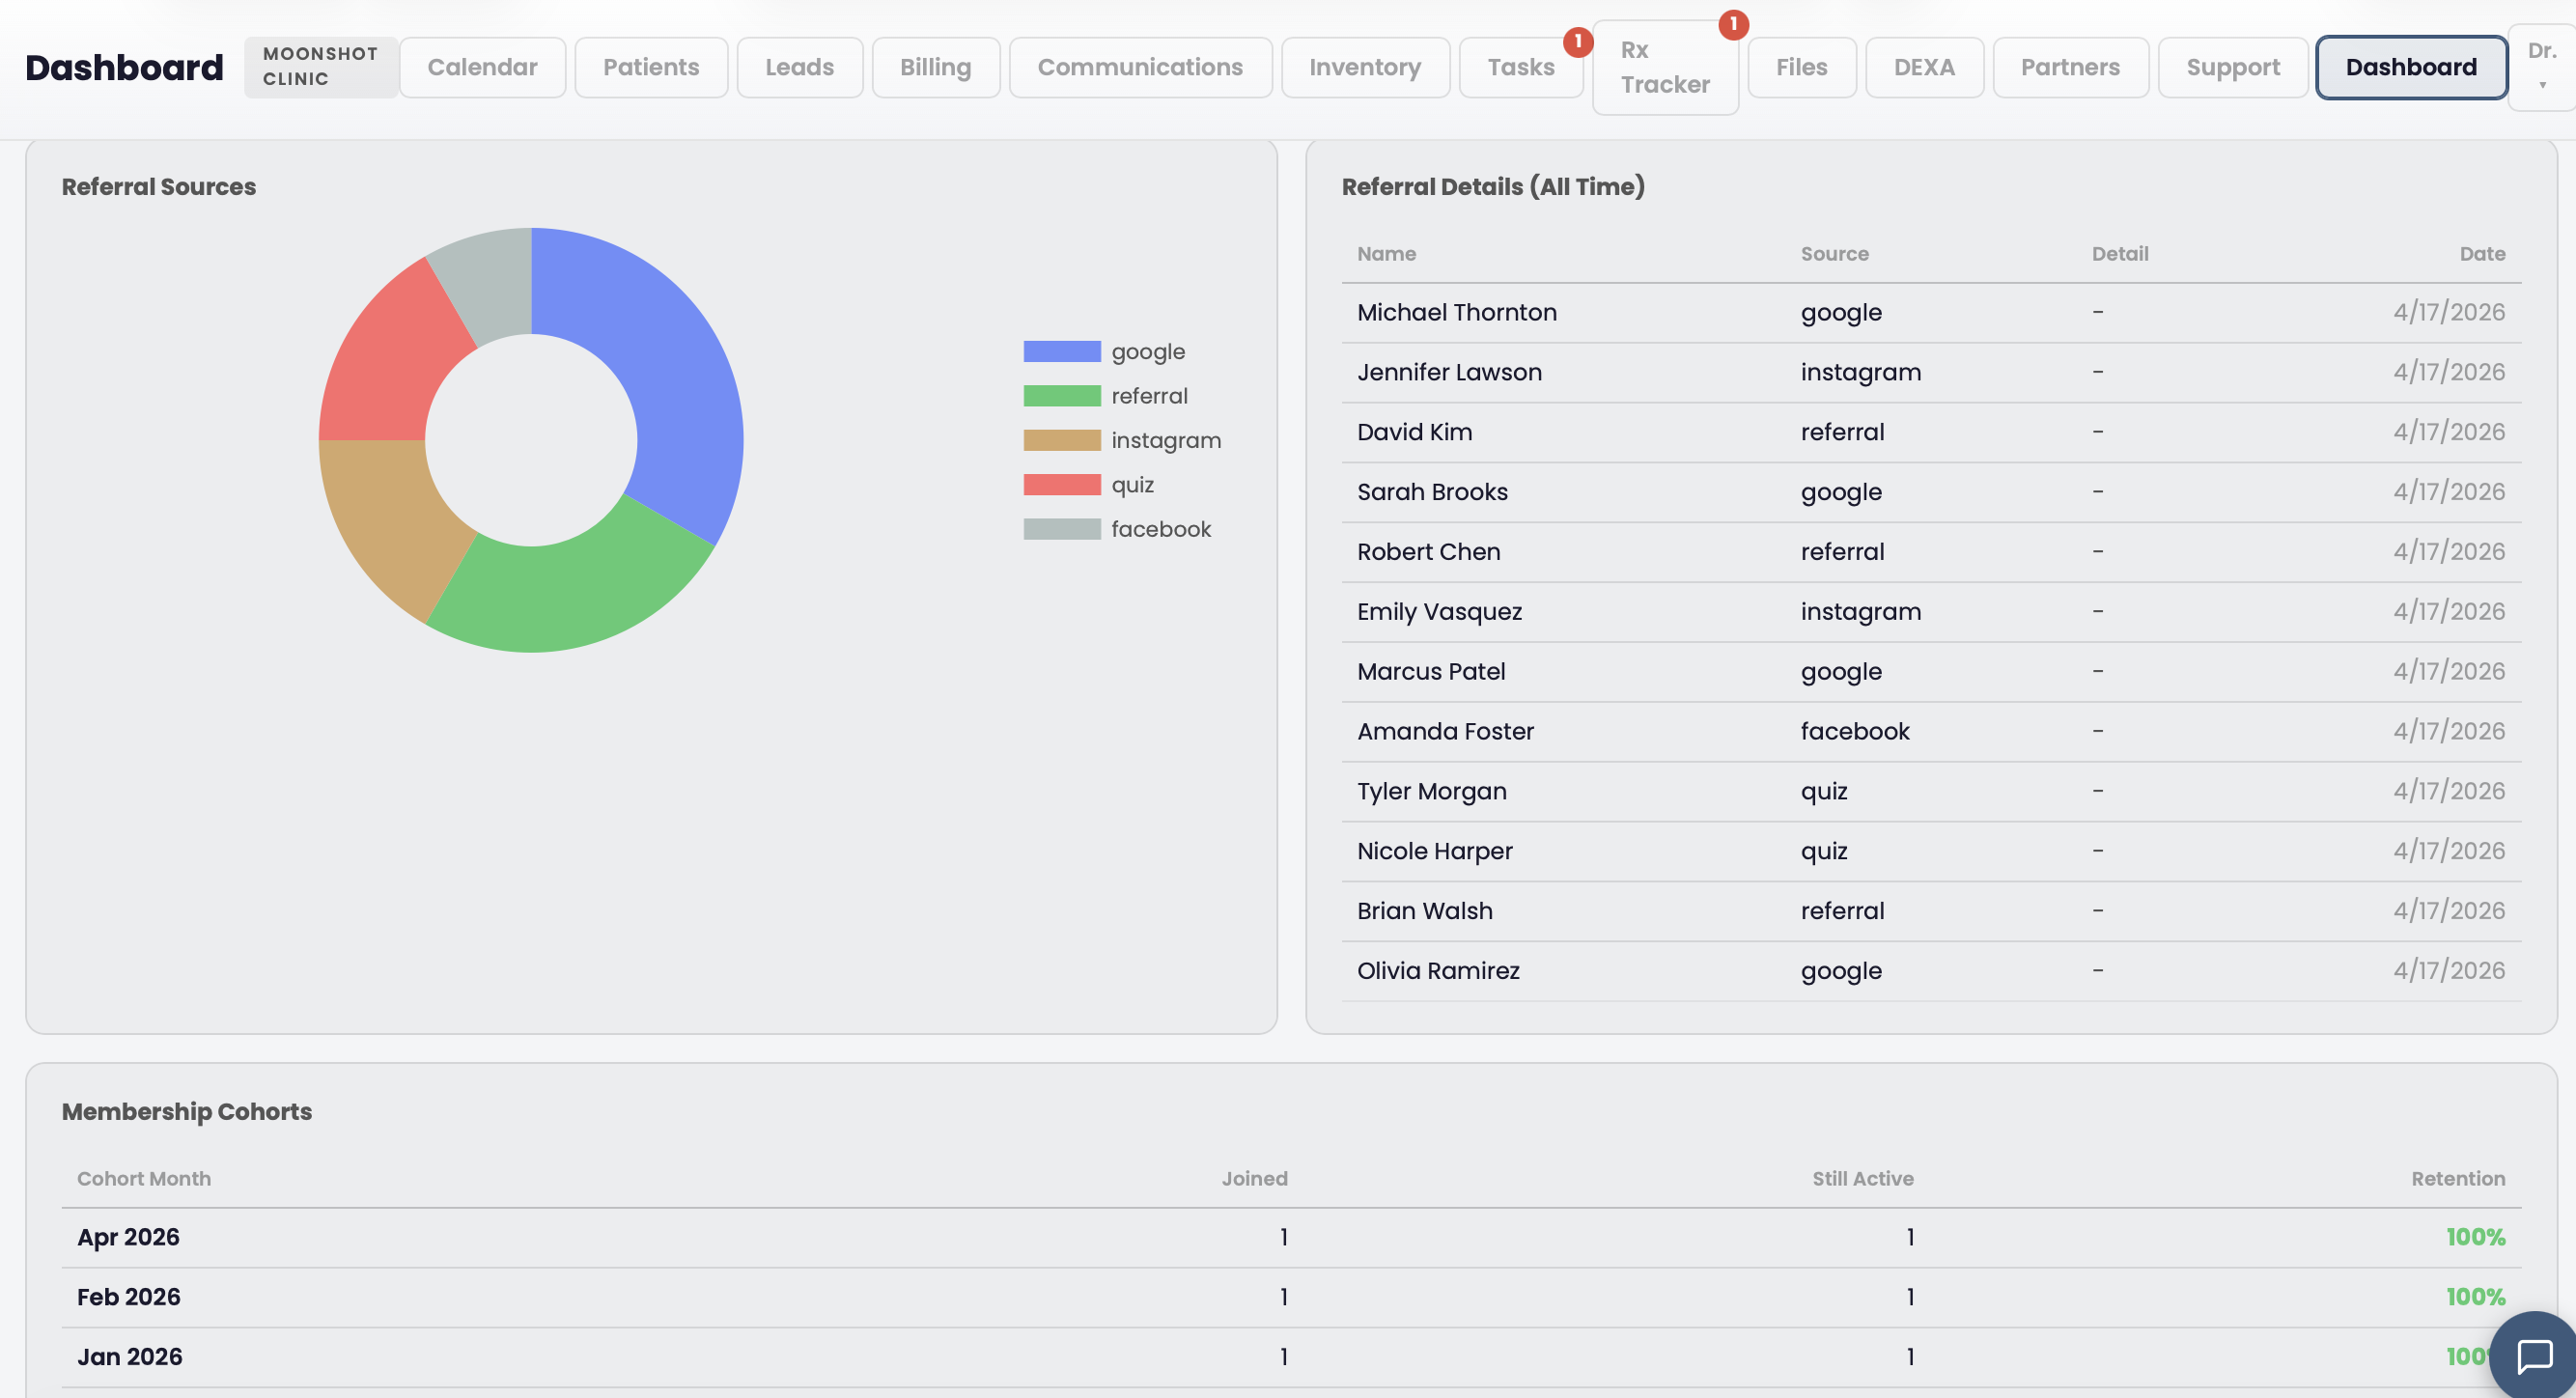
See where your patients come from. Track referral sources by volume and revenue to know which channels work.
New vs. returning patients, churn rate, and reactivation trends. Know who's staying and who's dropping off.
Appointments per provider, revenue per provider, and utilization rates. Compare providers across time periods.
See booked vs. available slots, no-show rates, and cancellation trends. Spot scheduling gaps before they become problems.
Filter every metric by service line. Compare TRT revenue to weight loss revenue. Find your highest-margin services.
Related Features
Dashboards for structured metrics. AI for ad-hoc questions. They complement each other.
Learn moreAppointment data feeds utilization metrics. See which slots fill and which sit empty.
Learn moreTrack portal adoption rates, form completion, and patient engagement across channels.
Learn moreBook a demo and we'll show you the analytics dashboard with real clinic data.
Get Started